Grafana je bezplatný a otevřený nástroj pro vizualizaci dat, který se používá ke sledování metrik z jiných hostitelů. Je napsán v Typescript and Go a umožňuje vám vytvářet a upravovat logovací i datové grafy a vytvářet metriky. Dokáže generovat grafy a dashboardy z databáze časových řad včetně Graphite, InfluxDB nebo OpenTSDB a umožňuje vám je sdílet s ostatními uživateli.
Funkce
- Šablony řídicího panelu
- Zřízení anotací
- Režim veřejného terminálu a seznamy skladeb
- Vlastní pluginy
- Výstražné a výstražné háčky
V tomto příspěvku vám ukážeme, jak nainstalovat Grafana 8 na Debian 11.
Předpoklady
- Server se systémem Debian 11.
- Platný název domény s adresou IP vašeho serveru.
- Na serveru je nakonfigurováno heslo uživatele root.
Začínáme
Před spuštěním se doporučuje aktualizovat systém na aktualizovanou verzi. Všechny balíčky můžete aktualizovat pomocí následujícího příkazu:
apt-get update -y
Po aktualizaci všech balíčků nainstalujte další požadované závislosti pomocí následujícího příkazu:
apt-get install gnupg2 curl wget git software-properties-common -y
Jakmile jsou všechny balíčky nainstalovány, můžete přejít k dalšímu kroku.
Instalovat Grafana 8
Ve výchozím nastavení není Grafana součástí výchozího úložiště Debian 11. Takže budete muset přidat úložiště Grafana do APT. Můžete jej přidat pomocí následujícího příkazu:
curl https://packages.grafana.com/gpg.key | apt-key add -
add-apt-repository "deb https://packages.grafana.com/oss/deb stable main"
Jakmile je úložiště přidáno, aktualizujte mezipaměť úložiště a nainstalujte Grafana pomocí následujícího příkazu:
apt-get update -y
apt-get install grafana -y
Jakmile je Grafana nainstalována, spusťte a povolte službu Grafana pomocí následujícího příkazu:
systemctl start grafana-server
systemctl enable grafana-server
Stav služby Grafana můžete také zkontrolovat pomocí následujícího příkazu:
systemctl status grafana-server
Získáte následující výstup:
? grafana-server.service - Grafana instance
     Loaded: loaded (/lib/systemd/system/grafana-server.service; disabled; vendor preset: enabled)
     Active: active (running) since Fri 2022-02-04 04:08:25 UTC; 5s ago
       Docs: http://docs.grafana.org
   Main PID: 8602 (grafana-server)
      Tasks: 9 (limit: 2341)
     Memory: 29.6M
        CPU: 1.299s
     CGroup: /system.slice/grafana-server.service
             ??8602 /usr/sbin/grafana-server --config=/etc/grafana/grafana.ini --pidfile=/run/grafana/grafana-server.pid --packaging=deb cfg:>

Feb 04 04:08:27 debian11 grafana-server[8602]: t=2022-02-04T04:08:27+0000 lvl=info msg="migrations completed" logger=migrator performed=381 s>
Feb 04 04:08:27 debian11 grafana-server[8602]: t=2022-02-04T04:08:27+0000 lvl=info msg="Created default admin" logger=sqlstore user=admin
Feb 04 04:08:27 debian11 grafana-server[8602]: t=2022-02-04T04:08:27+0000 lvl=info msg="Created default organization" logger=sqlstore
Feb 04 04:08:27 debian11 grafana-server[8602]: t=2022-02-04T04:08:27+0000 lvl=info msg="Initialising plugins" logger=plugin.manager
Feb 04 04:08:27 debian11 grafana-server[8602]: t=2022-02-04T04:08:27+0000 lvl=info msg="Plugin registered" logger=plugin.manager pluginId=inp>
Feb 04 04:08:27 debian11 grafana-server[8602]: t=2022-02-04T04:08:27+0000 lvl=info msg="Live Push Gateway initialization" logger=live.push_ht>
Feb 04 04:08:27 debian11 grafana-server[8602]: t=2022-02-04T04:08:27+0000 lvl=info msg="Writing PID file" logger=server path=/run/grafana/gra>
Feb 04 04:08:27 debian11 grafana-server[8602]: t=2022-02-04T04:08:27+0000 lvl=info msg="HTTP Server Listen" logger=http.server address=[::]:3>
Feb 04 04:08:27 debian11 grafana-server[8602]: t=2022-02-04T04:08:27+0000 lvl=info msg="warming cache for startup" logger=ngalert
Feb 04 04:08:27 debian11 grafana-server[8602]: t=2022-02-04T04:08:27+0000 lvl=info msg="starting MultiOrg Alertmanager" logger=ngalert.multio>
Ve výchozím nastavení Grafana naslouchá na portu 3000. Můžete to zkontrolovat pomocí následujícího příkazu:
ss -antpl | grep 3000
Získáte následující výstup:
LISTEN 0 4096 *:3000 *:* users:(("grafana-server",pid=8602,fd=8))
Instalovat Nginx jako reverzní proxy pro Grafana
Dále budete muset nainstalovat a nakonfigurovat Nginx jako reverzní proxy pro Grafana. Nejprve nainstalujte Nginx pomocí následujícího příkazu:
apt-get install nginx -y
Jakmile je Nginx nainstalován, vytvořte konfigurační soubor virtuálního hostitele Nginx pomocí následujícího příkazu:
nano /etc/nginx/conf.d/grafana.conf
Přidejte následující řádky:
server {
        server_name grafana.example.com;
        listen 80;
        access_log /var/log/nginx/grafana.log;


        location / {
                proxy_pass http://localhost:3000;
                proxy_set_header X-Forwarded-Host $host:$server_port;
                proxy_set_header X-Forwarded-Server $host;
                proxy_set_header X-Forwarded-For $proxy_add_x_forwarded_for;
        }
}
Po dokončení uložte a zavřete soubor. Poté pomocí následujícího příkazu ověřte, zda v Nginx nedošlo k chybě syntaxe:
nginx -t
Pokud je vše v pořádku, dostanete následující výstup:
nginx: the configuration file /etc/nginx/nginx.conf syntax is ok
nginx: configuration file /etc/nginx/nginx.conf test is successful
Poté restartujte Nginx, abyste použili změny konfigurace.
systemctl restart nginx
Stav Nginx můžete také zkontrolovat pomocí následujícího příkazu:
systemctl status nginx
Získáte následující výstup:
? nginx.service - A high performance web server and a reverse proxy server
     Loaded: loaded (/lib/systemd/system/nginx.service; enabled; vendor preset: enabled)
     Active: active (running) since Fri 2022-02-04 04:09:20 UTC; 4s ago
       Docs: man:nginx(8)
    Process: 8631 ExecStartPre=/usr/sbin/nginx -t -q -g daemon on; master_process on; (code=exited, status=0/SUCCESS)
    Process: 8632 ExecStart=/usr/sbin/nginx -g daemon on; master_process on; (code=exited, status=0/SUCCESS)
   Main PID: 8633 (nginx)
      Tasks: 2 (limit: 2341)
     Memory: 2.5M
        CPU: 35ms
     CGroup: /system.slice/nginx.service
             ??8633 nginx: master process /usr/sbin/nginx -g daemon on; master_process on;
             ??8634 nginx: worker process

Feb 04 04:09:20 debian11 systemd[1]: Starting A high performance web server and a reverse proxy server...
Feb 04 04:09:20 debian11 systemd[1]: nginx.service: Failed to parse PID from file /run/nginx.pid: Invalid argument
Feb 04 04:09:20 debian11 systemd[1]: Started A high performance web server and a reverse proxy server.
V tomto okamžiku je Nginx nainstalován a nakonfigurován jako reverzní proxy pro Grafana. Nyní můžete přejít k dalšímu kroku.
Přístup k řídicímu panelu Grafana
Nyní otevřete webový prohlížeč a přejděte na webové rozhraní Grafana pomocí adresy URL http://grafana.example.com . Budete přesměrováni na přihlašovací stránku Grafana:
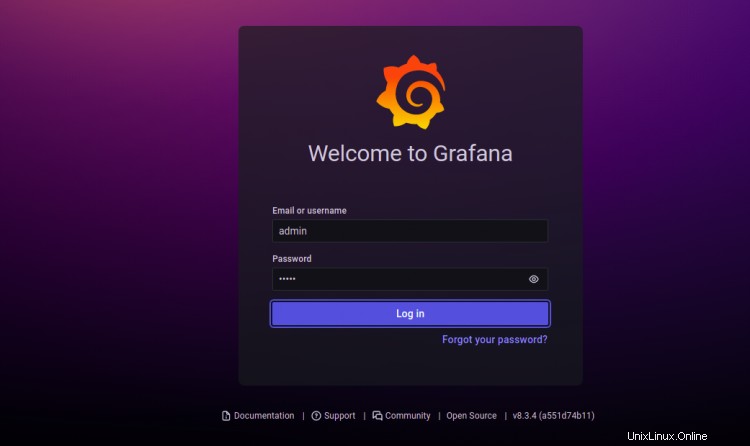
Zadejte své administrátorské uživatelské jméno, heslo a klikněte na Přihlásit se knoflík. Měli byste vidět obrazovku pro resetování hesla Grafana:
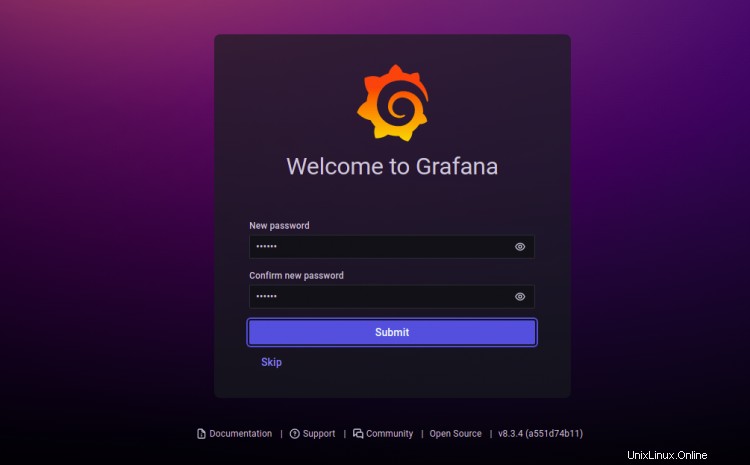
Nastavte si nové heslo a klikněte na Odeslat knoflík. Na následující obrazovce byste měli vidět řídicí panel Grafana:

Zabezpečte Grafana pomocí Let's Encrypt
Dále budete muset nainstalovat klientský balíček Certbot, abyste mohli nainstalovat a spravovat Let's Encrypt SSL.
Nejprve nainstalujte Certbot pomocí následujícího příkazu:
apt-get install certbot python3-certbot-nginx -y
Po dokončení instalace spusťte následující příkaz a nainstalujte Let's Encrypt SSL na svůj web:
certbot --nginx -d grafana.example.com
Budete požádáni, abyste poskytli platnou e-mailovou adresu a přijali podmínky služby, jak je uvedeno níže:
Saving debug log to /var/log/letsencrypt/letsencrypt.log
Plugins selected: Authenticator nginx, Installer nginx
Enter email address (used for urgent renewal and security notices) (Enter 'c' to
cancel): [email protected]

- - - - - - - - - - - - - - - - - - - - - - - - - - - - - - - - - - - - - - - -
Please read the Terms of Service at
https://letsencrypt.org/documents/LE-SA-v1.2-November-15-2017.pdf. You must
agree in order to register with the ACME server at
https://acme-v02.api.letsencrypt.org/directory
- - - - - - - - - - - - - - - - - - - - - - - - - - - - - - - - - - - - - - - -
(A)gree/(C)ancel: A

- - - - - - - - - - - - - - - - - - - - - - - - - - - - - - - - - - - - - - - -
Would you be willing to share your email address with the Electronic Frontier
Foundation, a founding partner of the Let's Encrypt project and the non-profit
organization that develops Certbot? We'd like to send you email about our work
encrypting the web, EFF news, campaigns, and ways to support digital freedom.
- - - - - - - - - - - - - - - - - - - - - - - - - - - - - - - - - - - - - - - -
(Y)es/(N)o: Y
Obtaining a new certificate
Performing the following challenges:
http-01 challenge for grafana.example.com
Waiting for verification...
Cleaning up challenges
Deploying Certificate to VirtualHost /etc/nginx/conf.d/grafana.conf
Dále zvolte, zda chcete přesměrovat provoz HTTP na HTTPS, jak je uvedeno níže:
- - - - - - - - - - - - - - - - - - - - - - - - - - - - - - - - - - - - - - - -
1: No redirect - Make no further changes to the webserver configuration.
2: Redirect - Make all requests redirect to secure HTTPS access. Choose this for
new sites, or if you're confident your site works on HTTPS. You can undo this
change by editing your web server's configuration.
- - - - - - - - - - - - - - - - - - - - - - - - - - - - - - - - - - - - - - - -
Select the appropriate number [1-2] then [enter] (press 'c' to cancel): 2
Zadejte 2 a stiskněte Enter pro dokončení instalace. Měli byste vidět následující výstup:
Redirecting all traffic on port 80 to ssl in /etc/nginx/conf.d/grafana.conf

- - - - - - - - - - - - - - - - - - - - - - - - - - - - - - - - - - - - - - - -
Congratulations! You have successfully enabled https://grafana.example.com

You should test your configuration at:
https://www.ssllabs.com/ssltest/analyze.html?d=grafana.example.com
- - - - - - - - - - - - - - - - - - - - - - - - - - - - - - - - - - - - - - - -

IMPORTANT NOTES:
 - Congratulations! Your certificate and chain have been saved at:
   /etc/letsencrypt/live/grafana.example.com/fullchain.pem
   Your key file has been saved at:
   /etc/letsencrypt/live/grafana.example.com/privkey.pem
   Your cert will expire on 2022-05-07. To obtain a new or tweaked
   version of this certificate in the future, simply run certbot again
   with the "certonly" option. To non-interactively renew *all* of
   your certificates, run "certbot renew"
 - Your account credentials have been saved in your Certbot
   configuration directory at /etc/letsencrypt. You should make a
   secure backup of this folder now. This configuration directory will
   also contain certificates and private keys obtained by Certbot so
   making regular backups of this folder is ideal.
 - If you like Certbot, please consider supporting our work by:

   Donating to ISRG / Let's Encrypt:   https://letsencrypt.org/donate
   Donating to EFF:                    https://eff.org/donate-le

 - We were unable to subscribe you the EFF mailing list because your
   e-mail address appears to be invalid. You can try again later by
   visiting https://act.eff.org.
Závěr
Gratulujeme! úspěšně jste nainstalovali Grafana 8 s Nginx a Let's Encrypt SSL na Debian 11. Nyní můžete přidat své vzdálené hostitele a začít je monitorovat z řídicího panelu Grafana. Pokud máte nějaké dotazy, neváhejte se mě zeptat.